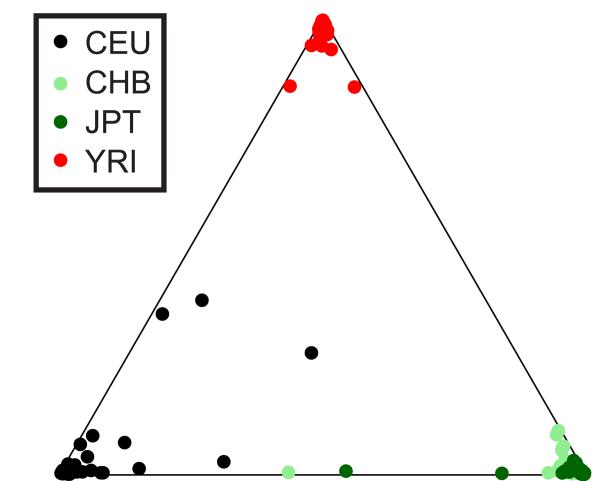
Figure 7. Population clustering from CNV genotypes.
A triangle plot showing the clustering of 210 unrelated HapMap individuals assuming three ancestral populations (k=3). The proximity of an individual to each apex of the triangle indicates the proportion of that genome that is estimated to have ancestry in each of the three inferred ancestral populations. The clustering together of most individuals from the same population near a common apex indicates the clear discrimination between populations obtained through this analysis. The clustering was qualitatively similar to that obtained previously with a similar number of biallelic Alu insertion polymorphisms on different African, European and Asian population samples 60.

