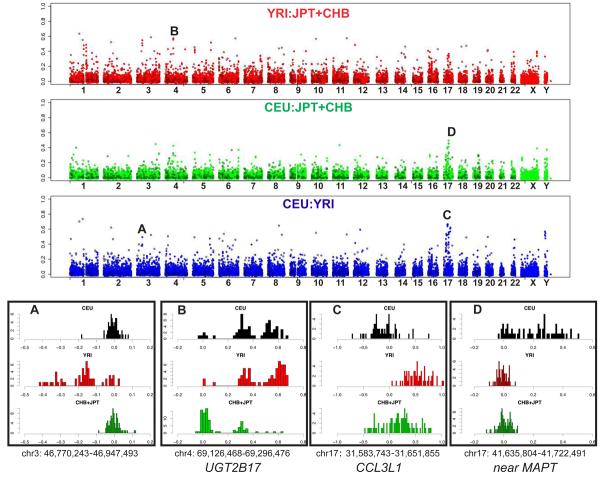
Figure 8. Population differentiation for copy number variation.
Population differentiation, estimated by VST, for each of the three population pairwise comparisons is plotted along each chromosome. For each pairwise comparison, the VST values for all clones on the WGTP platform are shown in the lighter colour with filled circles, with VST values of CNVs detected on the 500K EA platform superimposed in a darker shade with unfilled circles. Histograms showing the distributions of log2 ratios (on the WGTP platform) among the unrelated individuals in each population are plotted for 4 example CNVs exhibiting high population differentiation, labelled A-D. Each example histogram is labelled with the chromosome coordinates of the WGTP clone, and flanking/encompassed genes are given for those CNVs mentioned in the text.

