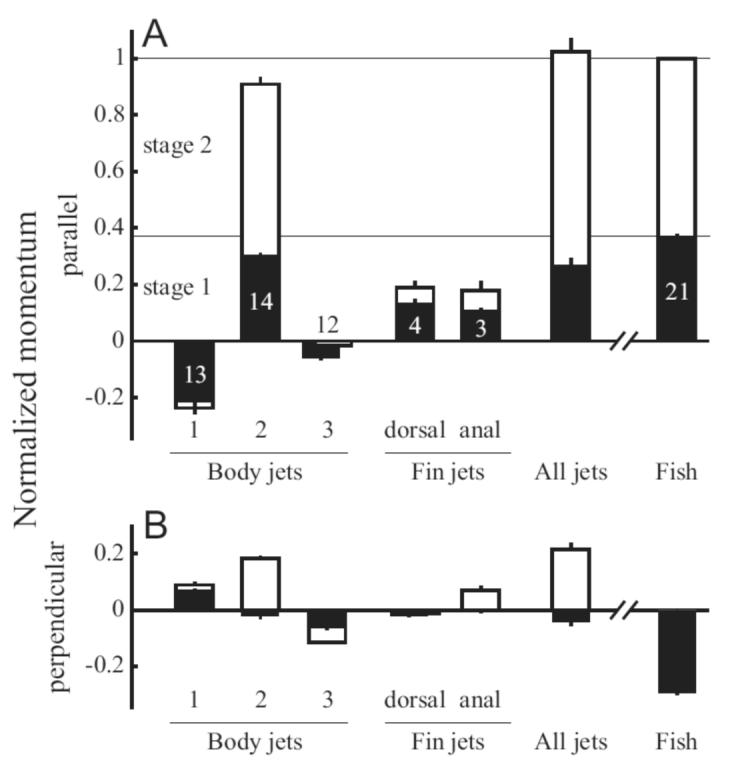
Fig. 8.

Fluid momentum matches the fish momentum parallel to the final trajectory. Momentum in each jet is shown for stage one (solid bars) and stage two (open bars) with error bars representing standard error. Numbers in each bar represent the number of sequences used to estimate momentum and are the same for both parallel (A) and perpendicular (B) estimates. The bar labeled “All jets” represents the sum of the mean momentum values for each body jet and the dorsal and anal fin jets. Momentum is scaled to the fish’s momentum M at the end of stage two. A: Momentum parallel to the final fish trajectory. The bars for jet 3 are shown offset from one another to indicate that momentum in that jet decreased from stage one to stage two. B: Momentum perpendicular to the final fish trajectory. Note that the perpendicular fish momentum at the end of stage two is zero by definition, so no open bar is shown.
