
Fig. 9.
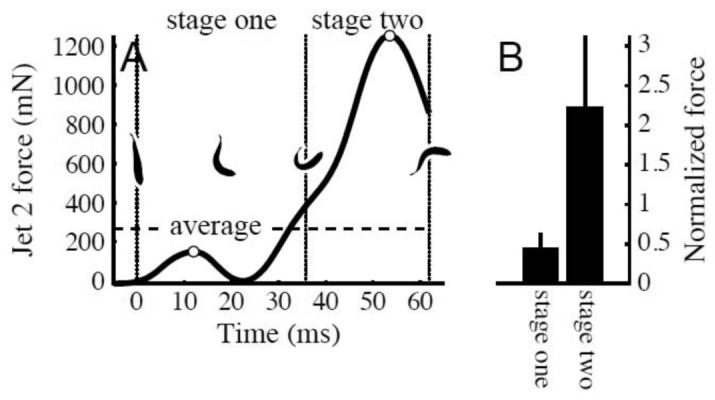
The force that produced jet 2 (i.e., the change in jet 2 momentum) typically had two peaks, one in stage one and another in stage two. (A) Example force trace showing the two peaks, identified with open circles. Stage one and two are separated by dotted lines. Outlines showing body conformation during the c-start are shown in the middle of the graph. The average force required to give the fish its final momentum is shown as a dashed line. Time zero is the time of first visible movement. (B) Mean values of the stage one and two peak forces (open circles in panel A) for all trials. Force has been normalized by the average force (dashed line in panel A) for each trial.