Figure 6.
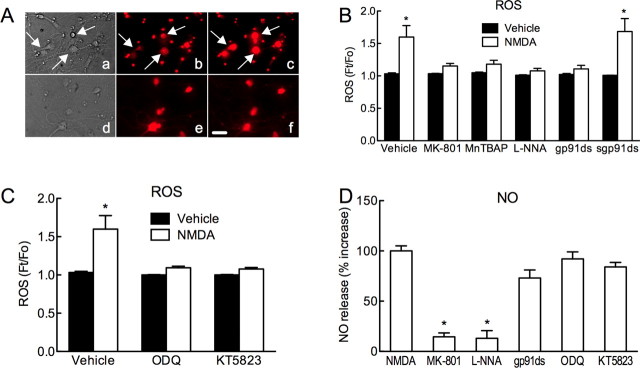
NMDA increases ROS in neuronal cultures via NO, cGMP, PKG, and NADPH oxidase. A, Bright-field images (a, d) and ROS-dependent fluorescence (DHE) (b, c, e, f) in neuronal cultures treated with vehicle (b), NMDA (40 μm) (c), MK-801 (5 μm) (e), or MK-801+NMDA (f). NMDA increases the ROS signal in neurons (arrows in a, b, c), but not after pretreatment with MK-801 (e, f). B, NMDA (40 μm) increases ROS production (n = 7). The increase is blocked by MK-801 (5 μm; n = 5), MnTBAP (100 μm; n = 9), the NOS inhibitor l-NNA (100 μm; n = 14), the peptide inhibitor of NADPH oxidase gp91ds-tat (gp91ds; 1 μm; n = 10), but not a scrambled control peptide (sgp91ds; 1 μm; n = 7) (*p < 0.05 from vehicle; ANOVA and Tukey's test). C, The increase in ROS induced by NMDA is attenuated by ODQ (100 μm; n = 10) or KT5823 (5 μm; n = 6) (*p < 0.05 from vehicle; ANOVA and Tukey's test). D, NMDA (40 μm) increases NO release. The increase is blocked by MK-801 or l-NNA (100 μm). gp91ds-tat (gp91ds; 1 μm), ODQ, and KT5823 do not affect NMDA-induced NO release (*p < 0.05 from NMDA; ANOVA and Tukey's test; n = 4/group). Scale bar, 10 μm.

