Figure 4.
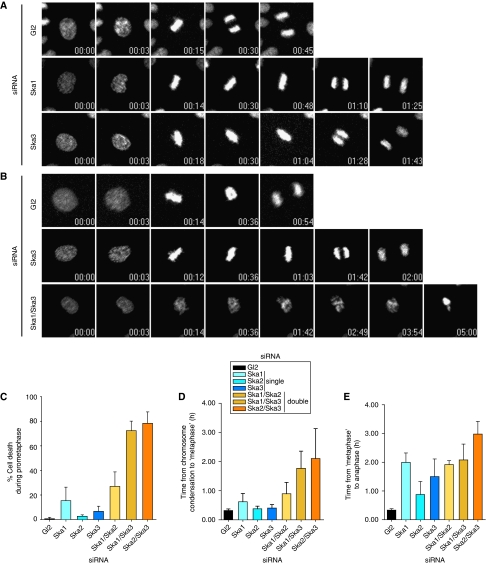
Time-lapse microscopy analysis of Ska-depleted cells. (A) Stills of representative movies of HeLa S3 cells stably expressing H2B-GFP treated with control (Gl2), Ska1 and Ska3 siRNAs for 36 h before filming. T=0 was defined as the time point one frame before chromosome condensation became evident (prophase). N=3 independent experiments with at least 40 cells counted in each condition. Time points are indicated in h:min. (B) Stills of representative movies of H2B-GFP expressing HeLa S3 cells treated with control (Gl2), Ska3 and Ska1/Ska3 siRNAs for 36 h before filming. T=0 was defined as the time point one frame before chromosome condensation became evident (prophase). N=3 independent experiments with at least 40 cells counted in each condition. Time points are indicated in h:min. (C) The percentage of cells dying in prometaphase calculated from time-lapse movies (Supplementary Movies S4, S5, S6 and S7 and data not shown) of at least 40 siRNA-treated cells per condition per experiment. Histograms show averages from three independent experiments. Error bars represent s.d. The duration from prophase to anaphase onset was calculated from time-lapse movies (Supplementary Movies S4, S5, S6 and S7 and data not shown) of at least 40 siRNA-treated cells per condition per experiment. Time 0 is defined as the first frame where chromosome condensation was apparent. Metaphase was defined as the first frame displaying complete alignment, and anaphase onset was calculated from the first frame at which chromosome segregation was visible. Histograms show the time for progression from chromosome condensation to first complete alignment (D) and from first metaphase until anaphase onset (E). Data are presented as averages from three independent experiments. Error bars represent s.d.

