Figure 5.
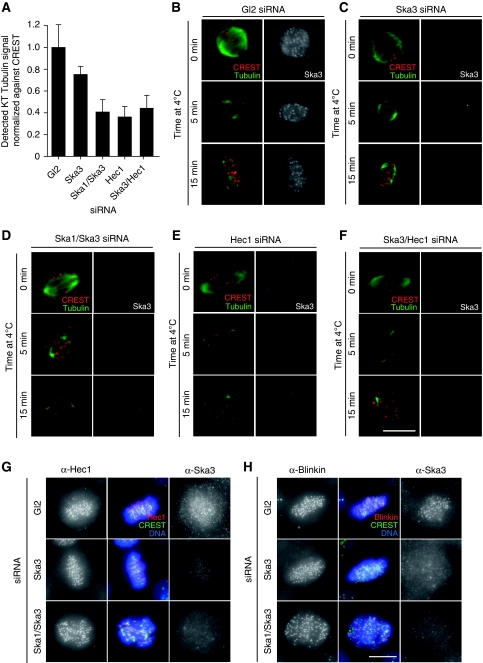
Stable MT–KT interactions are dependent on the Ska complex. (A) Histogram represents extent of KT–MT attachment by the level of α-Tubulin signal within the vicinity of the KT (normalized to the CREST signal) in HeLa S3 cells treated for 48 h with control (Gl2), Ska3, Ska1/Ska3, Hec1 or Ska3/Hec1 siRNAs. A significant decrease in α-Tubulin was detected between Gl2 and all other conditions (P<0.01, Student's t-test), and Ska3 and all other combinations (P<0.01). No significant difference was detected among Ska1/Ska3, Hec1 and Ska3/Hec1 siRNA treatment (P>0.01). The average intensity of 30 KT per cell was measured, and bars represent mean and s.d. from five cells per condition. (B–F) HeLa S3 cells were treated with the same combination of siRNA treatments as in (A) and either fixed directly (upper panels) or incubated at 4°C for either 5 min (middle panels) or 15 min (lower panels) before fixation. Cells were stained with anti-α-Tubulin (green), CREST serum (red) and anti-Ska3. Bar=10 μm. Cells were treated for 48 h with control (Gl2), or Ska3 and Ska1/Ska3 specific siRNAs. Cells were fixed with PTEMF and stained with either anti-Hec1 (G) or anti-Blinkin (H) antibodies (red), CREST serum (green) and Ska3 (right columns, respectively). DNA was visualized using DAPI (blue). Bar=10 μm.

