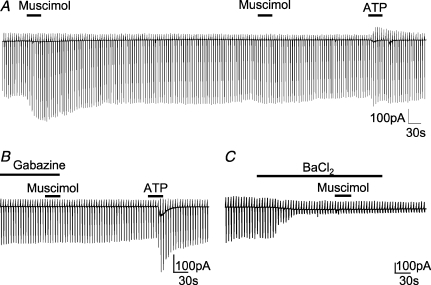
Figure 2. GABAA receptor-specific muscimol-induced current response in amoeboid microglia.
Membrane currents from amoeboid microglia were recorded in response to voltage steps as described in Fig. 1C. The individual voltage steps cannot be resolved at this low time resolution display. A, muscimol (100 μm; 30 s) was applied twice interrupted by a 10 min interval. After another 3 min, ATP was applied (500 μm; 30 s). B, muscimol (100 μm; 30 s) was also applied in the presence of gabazine (10 μm; 1.5 min pre-application) followed by ATP (1 mm; 30 s). C, muscimol (100 μm; 30 s) was applied in the presence of BaCl2 (100 μm; 2 min pre-application).

