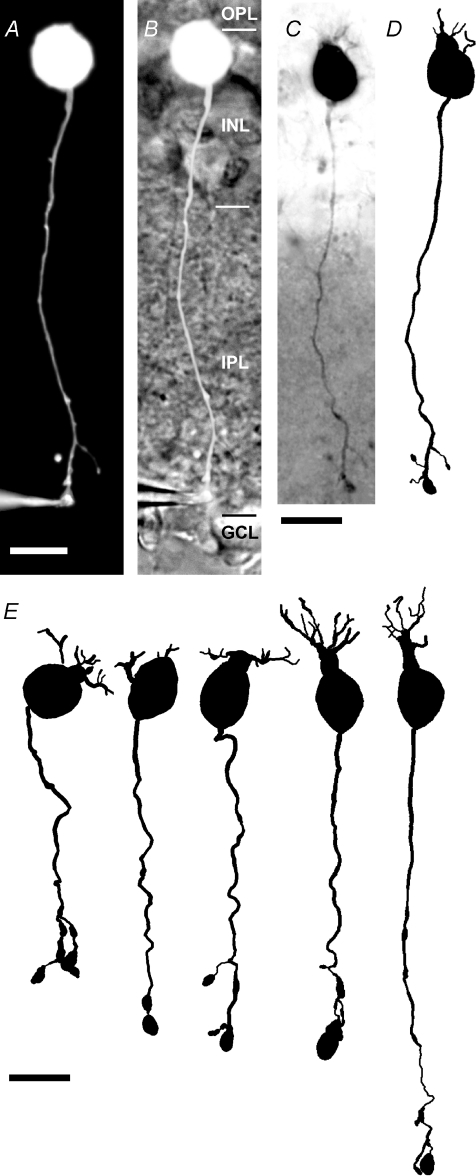
Figure 1. Axon terminal whole-cell recording and morphological reconstruction of rod bipolar cells in a retinal slice preparation.
A, composite fluorescence digital micrograph of a rod bipolar cell (same cell in A–D) filled with Lucifer yellow from a recording patch pipette at the axon terminal (A and B). The micrograph was generated by assembling a series of images taken with epifluorescent illumination at different focal planes. Scale bar (A and B): 10 μm. B, micrograph in A overlaid on a digital micrograph showing the position of the cell in the retinal slice. The retinal layers are indicated by abbreviations (OPL, outer plexiform layer; INL, inner nuclear layer; IPL, inner plexiform layer; GCL, ganglion cell layer) and the borders between them are indicated by horizontal lines. C, composite digital photomicrograph of rod bipolar cell filled with biocytin during recording. The micrograph was generated by assembling a series of images taken at different focal planes. Scale bar (C and D): 10 μm. D, shape plot of the morphologically reconstructed cell. E, shape plots of reconstructed cells illustrate range of morphological variability among rod bipolar cells. Scale bar: 10 μm.

