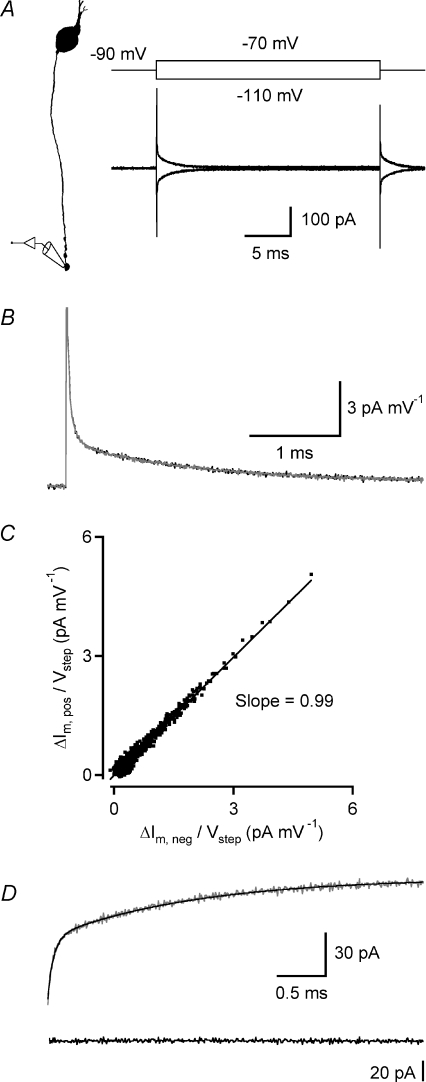
Figure 5. Influence of steady-state activation of Ih on membrane properties of rod bipolar cells.
A, current responses (bottom; average of 45 trials) of a rod bipolar cell to 25 ms voltage pulses to −110 and −70 mV from a holding potential of −90 mV (top) applied in axon terminal whole-cell recording. Diagram (left) indicates recording configuration and shape plot of the morphologically reconstructed cell. Same cell in A–D. B, current responses in A were scaled with the applied voltage pulse amplitude and superimposed to examine linearity. Superimposition of current response to −110 mV (black trace) and current response to −70 mV (grey trace) indicate that they scale linearly with voltage. Time scale expanded to display onset and initial decay of current transients with higher temporal resolution. C, the current responses to the ±20 mV voltage pulse stimuli were plotted against each other for corresponding points in time during a 25 ms time interval, starting 50 μs after onset of the stimulus. The straight line indicates a linear fit to the data points and has a slope of 0.99. D, top, current response of rod bipolar cell (grey trace; average of 45 trials) and passive compartment model (black trace) to 20 mV hyperpolarizing voltage pulse (as in A). The compartment model was obtained by directly fitting the current responses of the model evoked by voltage pulses to the experimental data in NEURON with four free parameters (Ri, Cm, Rm and Rs). Time scale expanded to display decay of current responses at higher temporal resolution. D, bottom, curve fit residual (difference between experimental and model current response).

