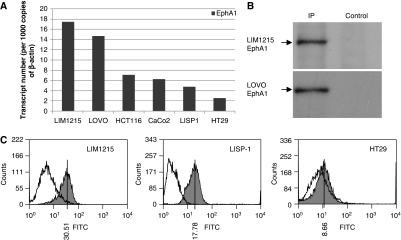
Figure 1.
EphA1 mRNA and protein expression in colorectal cancer (CRC) cell lines. (A) EphA1 transcript levels normalised to 1000 copies of β-actin quantitated by qPCR. (B) EphA1 protein expression in LIM1215 and LOVO cell lines determined through immunoprecipitation followed by western blot analysis using an in-house rabbit anti-EphA1 antibody. (C) EphA1 protein levels determined by flow cytometry analysis. Fluorescence resulting from EphA1 protein expression (shaded) is shown relative to the secondary-only control cells. The median fluorescence value is shown.

