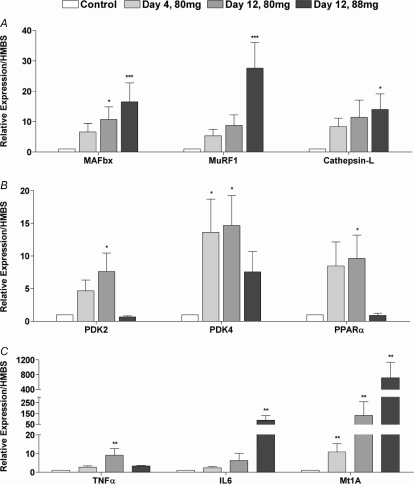
Figure 2. mRNA expression (fold changes relative to Control) determined in biceps femoris muscle of Control animals and animals dosed daily with 80 mg kg−1 day−1 simvastatin for 4 and 12 days and 88 mg kg−1 day−1 simvastatin for 12 days.
A, MAFbx, MuRF-1 and cathepsin-L expression; B, PDK2, PDK4 and PPARα expression; C, TNFα, IL6 and Mt1A expression. Values expressed as mean fold changes relative to Control ±s.e.m.*P < 0.05, **P < 0.01, ***P < 0.001 when compared to Control (which is set at 1).

