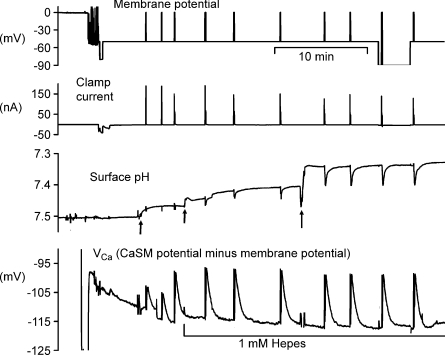
Figure 1. Hyperpolarization has little effect on surface pH and [Ca2+]i recovery after brief depolarizations.
This figure shows the first 40 min of an experiment. The top record shows the membrane potential, clamped at −50 mV once the microelectrodes had been inserted. After 5 min, a series of depolarizations to 0 mV was imposed, the first two for 1 s, the rest for 5 s to allow Ca2+ entry. The second record shows the clamp current, while the third trace shows the surface pH recorded from a pHSM pressed against the cell body at the first arrow. This electrode was later moved (2nd and 3rd arrows) to increase the responses. The bottom trace shows VCa recorded with a CaSM pushed deep into the cell and manipulated to achieve a stable recording. After the first 3 depolarizations the Hepes concentration in the superfusate was decreased from 20 to 1 mm. Before and after the ninth depolarization the membrane potential was held at −90 mV for 20 and 180 s, respectively.

