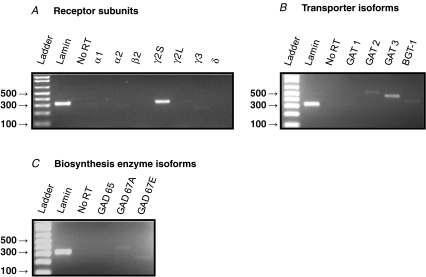
Figure 8. RT-PCR analysis of GABAergic marker expression in whole P14 rat carotid bodies.
Products were run on 2% agarose gel stained with ethidium bromide and viewed under UV illumination. A, expression of GABAA receptor subunits. B, expression of GABA transporter (GAT) isoforms. C, expression of GABA biosynthetic enzyme isoforms. Ladder band sizes are given in base pairs. Lamin (A/C) housekeeping gene was used as a positive control. No RT lane refers to negative control reactions in which water replaced Superscript III reverse transcriptase. All band identities were verified by sequencing (MOBIX, McMaster University, Canada).

