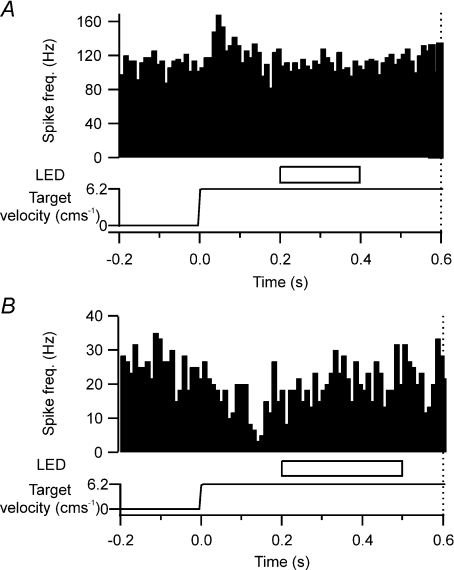
Figure 2. Purkinje cell simple spike phasic activity in relation to target motion.
A, peri-event time histogram (PETH) showing an example of a phasic increase in simple spike activity in response to the onset of target motion. Target motion started at time zero. Target was occluded at 200 ms after the start of target onset for a duration of 200 ms (horizontal open bar, labelled LED). Dotted vertical line at 0.6 s after onset of target movement represents the time point of the ‘go’ signal. Time course of target velocity is represented in the bottom trace. B, same as A, but representative example of a phasic decrease in simple spike activity in response to the onset of target motion and the target occluded for 300 ms.

