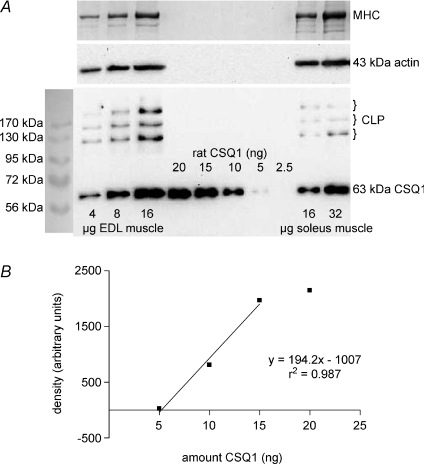
Figure 1. Quantification of CSQ1 in rat EDL and soleus muscle homogenates.
A, protein from rat EDL and soleus whole muscle homogenates (4–32 μg muscle wet weight, as indicated) and 2.5–20 ng purified CSQ1 (prepared from rat skeletal muscle), were separated on a 10% SDS-PAGE gel and CSQ1 detected by Western blotting (anti-CSQ1). To verify relative amounts of muscle loaded, membranes were reprobed for actin (middle panel), and also gels were stained with Coomassie Blue following transfer to identify myosin heavy chain (MHC, top panel). Calsequestrin-like proteins (CLP) were also observed in all homogenate samples. B, density of band for purified CSQ1 plotted against amount of protein. Amount of CSQ1 in EDL and soleus homogenates (1.55 and 0.56 ng (μg muscle wet weight)−1, respectively) determined from intensity of bands that fell within linear range for samples of purified CSQ1 on the same gel (shown in A).

