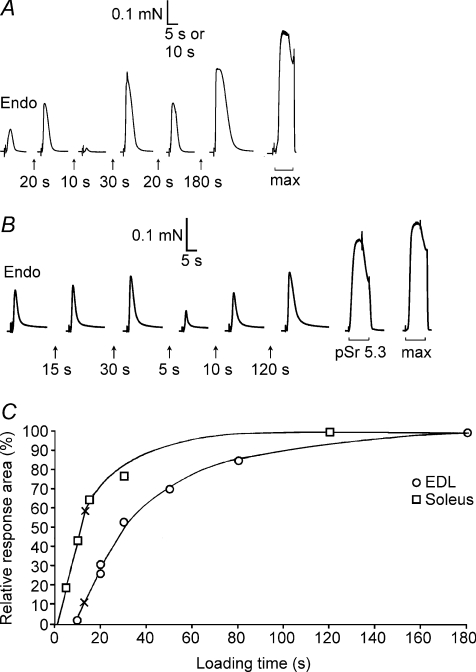
Figure 4. Assay of SR Ca2+ content and loading properties in fibres with known CSQ.
A, force responses of skinned EDL fibre segment upon releasing all SR Ca2+ by exposure to 30 mm caffeine–low [Mg2+] solution. First response (‘Endo’) reflects release of endogenous Ca2+ content. The SR was reloaded by bathing the segment for the indicated time in solution at pCa 6.7 with 1.0 mm total EGTA. Maximal Ca2+-activated force (in response to ‘max’ solution) is shown on a slower time scale. The fibre segment had ∼120% of average EDL CSQ1 content, no CSQ2 and typical EDL SERCA1 content. B, force responses in SOL (I) fibre; high relative force response in solution with pSr 5.3 indicates type I fibre. Calsequestrin 1 content was ∼20% of EDL average, typical SOL level of CSQ2, and SERCA1 was not determined. C, time integral of force responses versus load time for fibres in A and B, expressed as a percentage of the maximal value. Crosses indicate the time required to reload SR Ca2+ to the level present endogenously. In A and B, the force artefacts upon changing solution (start of each record) are shown on a compressed time scale.

