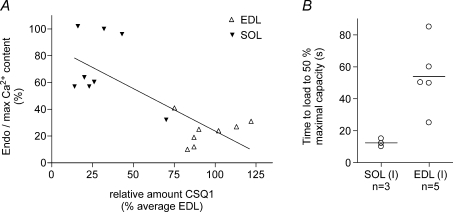
Figure 5. Relationship between CSQ1 amount and Ca2+ content in single fibres.
A, endogenous Ca2+ content present in SR in a fibre segment expressed as a percentage of maximal Ca2+ content (see Fig. 4) plotted against the amount of CSQ1 in the fibre segment. Calsequestrin 1 in the fibre segment is expressed relative to the mean for EDL fibres on the same gel (see Fig. 3). Linear regression analysis indicates a significant inverse relationship (r2= 0.55, P < 0.005). B, time taken to reload SR to 50% of maximal capacity (see Fig. 4; load solution at pCa 6.7 with moderate Ca2+ buffering; 0.5 mm CaEGTA, 0.5 mm free EGTA). Lines indicate means for the two fibre types. Calsequestrin 1 was present in EDL fibres at 83–102% of EDL average, and in soleus fibres at 14–32%. In both A and B, all soleus fibres were shown to be type I by Sr2+ sensitivity. Calsequestrin 2 was present in all SOL (I) fibres and absent in all EDL fibres. SERCA1 was present at high density in all EDL fibres and negligible in all SOL (I) fibres; not measured in one fibre of each type in B.

