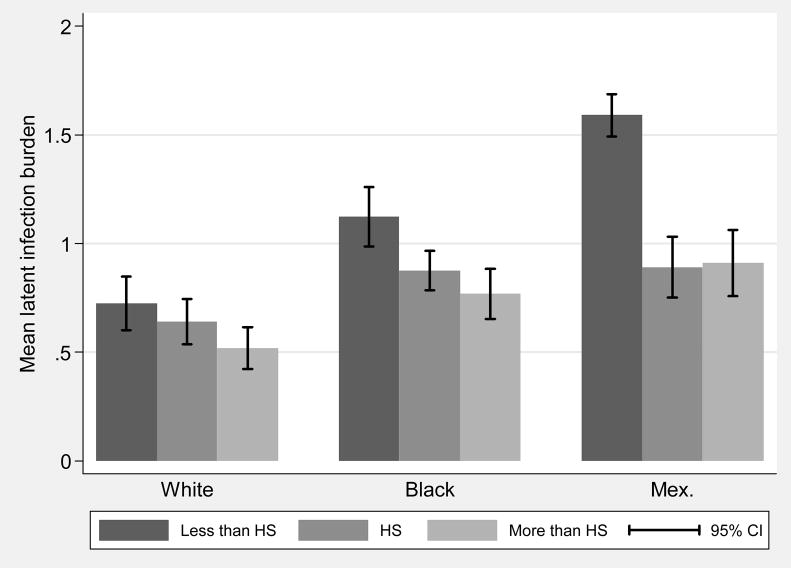
Figure 2.
Mean infection burden by race and parental education: children age 6–16, NHANES III.
Note: white=non-Hispanic white, black=non-Hispanic black, Mex.=Mexican-American, parental education refers to the educational attainment of the household head.. The figure shows the mean infection burden factor score by race and education. The factor score indicating infection burden was calculated using the five infection indicators and standardized with a mean of one and a variance of one.

