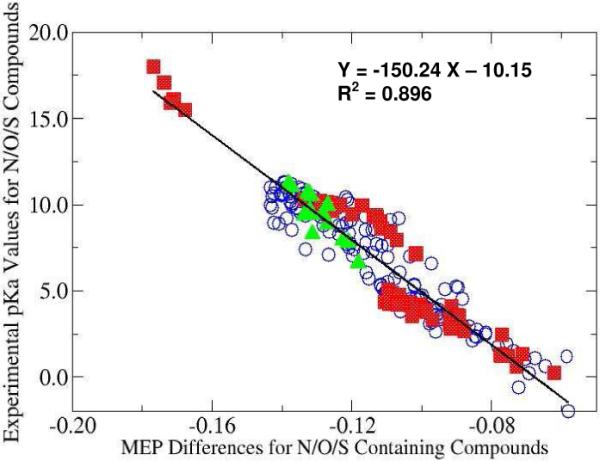
Figure 2.

Linear relationship between the MEP difference and experimental pKa values for all 228 data points. The MEP reference value for N, O, and S compounds is −18.28, −22.20, and −59.12 a.u., respectively. Symbols: N: open blue cycle; O: filled red square; S: filled green triangle
