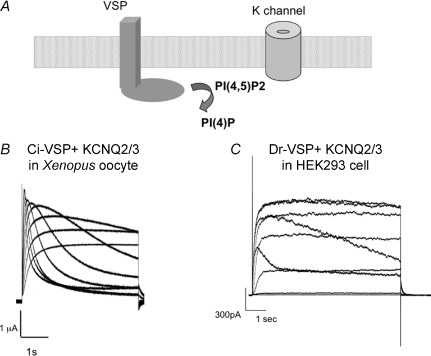
Figure 3. KCNQ2/3 current decay induced by VSP expressed in oocyte and tsA201 cell.
A, schematic diagram of regulation of K+ channel activity by changes in the concentration of PI(4,5)P2 induced by the dephosphorylating activity of VSP. B and C, two examples of voltage-induced change of VSP enzyme activities reported by KCNQ2/3 channels are shown. B, traces of KCNQ2/3 currents from a Xenopus oocyte coexpressing KCNQ2/3 and Ci-VSP (Murata et al. 2005). Voltage was stepped in 10 mV increments ranging from −20 to +60 mV from a holding potential of −60 mV. Note that the decay becomes sharper as the voltage increases. C, traces of KCNQ2/3 currents from HEK293 cells coexpressing KCNQ2/3 and Dr-VSP (Hossain et al. 2008). Voltage was stepped in 20 mV increments ranging from −60 to +100 mV from a holding potential of −80 mV.

