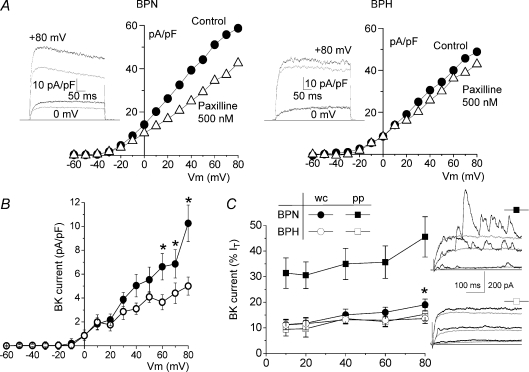
Figure 3. Characterization of BKCa currents.
A, representative current–voltage relationships obtained under control conditions and in the presence of 500 nm paxilline in BPN and BPH cells in whole-cell experiments. Current traces upon depolarization at +80 mV and 0 mV in both conditions are also shown on the left. Grey traces correspond to records in the presence of paxilline. B, average paxilline-sensitive I–V curves obtained in BPN (•) and BPH cells (^); n= 16, whole-cell recordings. C, contribution of BKCa currents in BPN (filled symbols) and BPH cells (open symbols), expressed as a percentage of the total outward current. BKCa currents were calculated as the difference in the current amplitude at the indicated voltages between control and paxilline traces, both in whole-cell (circles) and in perforated-patch (squares). Data are means ±s.e.m. of 7–15 determinations in each group. *P < 0.05 compared to BPH whole-cell data. Representative traces from one BPN and one BPH cell obtained in perforated-patch recordings upon depolarization to +60 mV before and during paxilline application are also shown.

