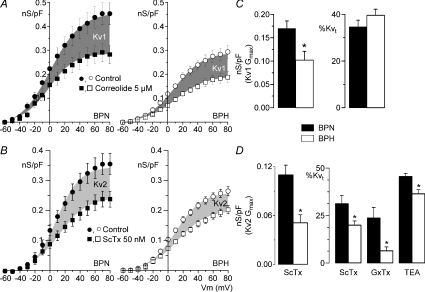
Figure 5. Quantification of Kv1 and Kv2 contribution to Kv currents.
Conductance (nS pF−1)–voltage relationships obtained in BPN (•, ▪) and BPH (^, □) cells in the presence of 500 nm paxilline (control) and after application of 5 μm correolide (A) or 50 nm ScTx (B). Data points are means ±s.e.m.; n= 8–12 in each group. The shaded areas are delimited by the Boltzmann fits of the two curves and represent the correolide-sensitive (Kv1) and ScTx-sensititive (Kv2) fractions of the total conductance. Gmax values for the Kv1 (C) and Kv2 (D) components were obtained by subtracting the Gmax of the drug-resistant from the Gmax of the control G–V fits to Boltzmann functions in each cell. Right graph bars show the percentual contribution of Kv1 (C) and Kv2 (D) computed as percentage of total Kv conductance (Kvt) at +40 mV. The proportion of the Kv2 component was also studied by using 20 nm GxTx and 20 mm TEA (after correolide). Means ±s.e.m. of 7–12 data.

