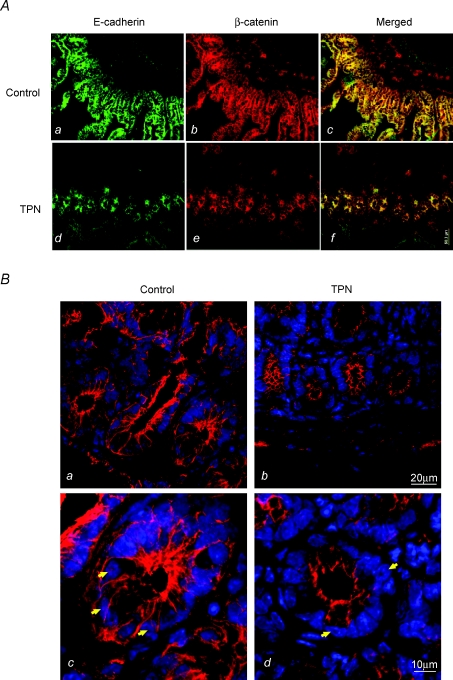
Figure 4.
A, representative immunofluoresence staining for E-cadherin and β-catenin in the crypt region. B, a detailed imaging of β-catenin in the crypt cells of the small intestine is shown. Note that compared to controls (a and c), TPN administration (b and d) led to a decline in β-catenin expression in crypt cells (shown by white arrows), and a marked loss of cytosolic and nuclear β-catenin expression was detected in the TPN mice.

