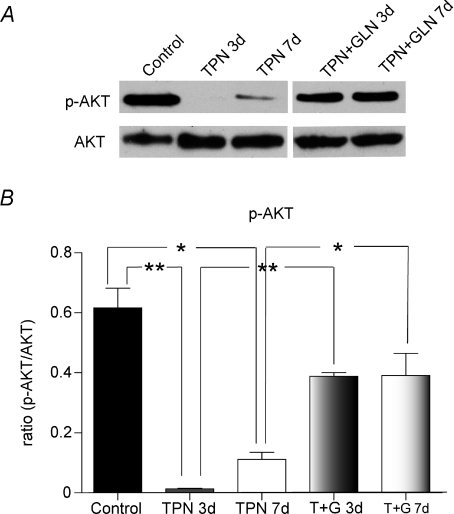
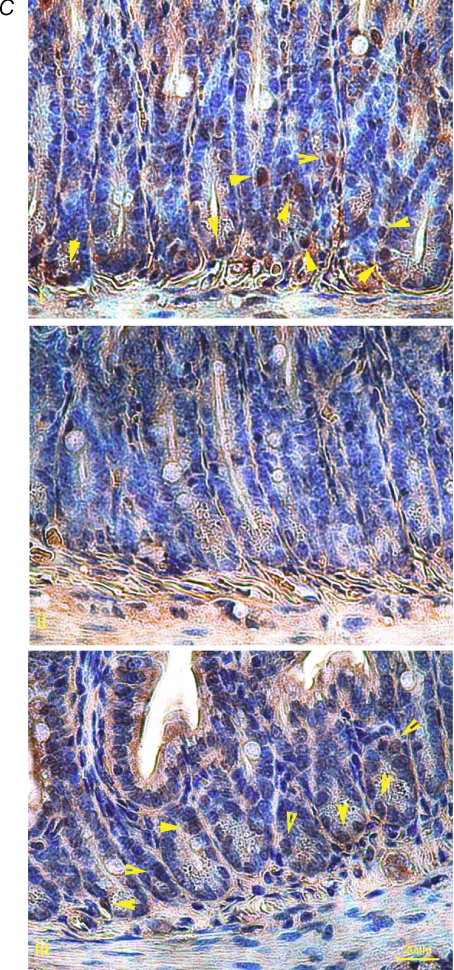
Figure 6. Phosphorylated-Akt (p-AKT) activity decreased with TPN administration.
A, shown are representative bands for p-Akt and total Akt expression for TPN and control groups. B, the ratio of p-AKT to total AKT decreased with TPN administration, at 3 and 7 days. Glutamine administration partially reversed this decline. C, p-AKT immunohistochemical expression showed similar results. In control mice, large numbers of positive staining cells (shown by yellow arrows) were found at the base of the crypt (a upper panel). After 3 days of TPN administration (b middle panel), p-AKT positive cells were markedly decreased in numbers. The lower panel (c) shows p-AKT expression in the TPN + glutamine group. Note that the loss of p-AKT expression was partly prevented with the addition of glutamine. n= 4–6 per group; *P < 0.01 **P < 0.001.


