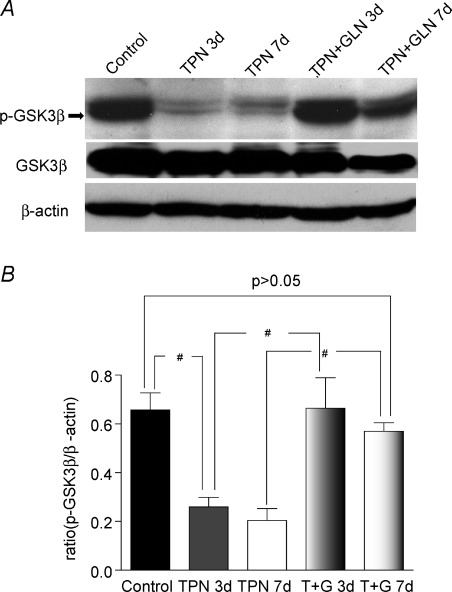
Figure 7. Expression of p-GSK3β was down-regulated with TPN administration.
A, representative bands of p-GSK3β and total GSK3β are shown for each study group, as well as β-actin for normalization. Note that GSK3β is shown as the lower of the two bands; and GSK3α is the upper band. B, results of Western immunoblotting as expressed as the ratio of the protein expression of p-GSK3β to total GSK3β. Note the decline in p-GSK3β with TPN administration, and this down-regulation was reversed with glutamine. #P < 0.05, n= 4–6 per group.

