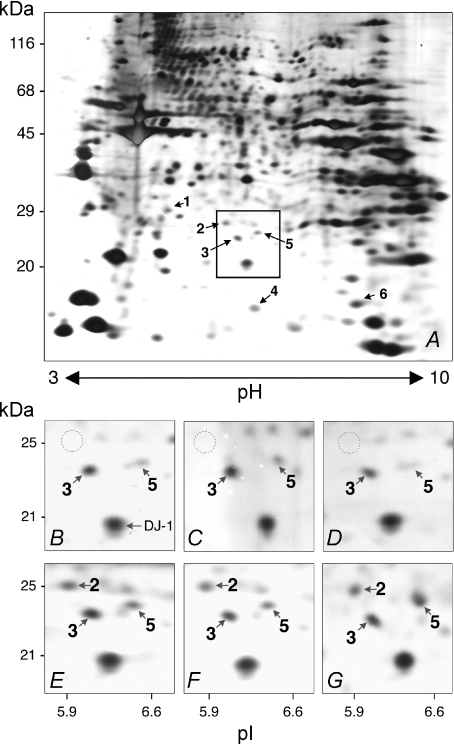
Figure 1. 2D-PAGE of proteins isolated from EDL of nNOS-knockout mice and C57 control mice.
A, 60 μg of protein derived from the urea extract isolated from the EDL of a nNOS-knockout mouse was subjected to 2D-PAGE after IEF on IPG strips covering the non-linear pH range 3–10. Numbered arrows point to spots that were significantly more intense in the EDL extracts of nNOS-knockout mice than in the co-analysed ones of C57 control mice on the silver-stained gel after densitometric analysis as listed in Table 1. The box indicates the gel area that is shown in higher magnification in panels B–G. B–G, spot 2 (molecular mass 25 kDa; pI 5.9) was present only in nNOS-knockout mice (E–G), not C57 control mice (B–D), as exemplified individually for three animals of each strain. LC-MS/MS revealed this protein to be peroxiredoxin-6. The spot marked as ‘DJ-1’ in B denotes a protein whose levels were not influenced by nNOS-deficiency. The areas corresponding to spot 2 are encircled in B–D.

