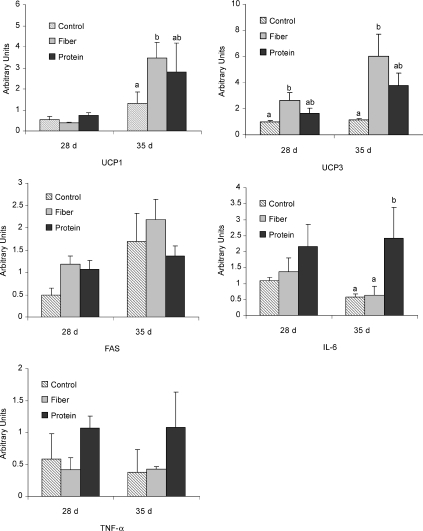
Figure 5. Expression of UCP-1, UCP-3, FAS, IL-6 and TNF-α mRNA in brown adipose tissue of young rats fed high fibre or high protein diets.
Individual graphs represent UCP-1, UCP-3, FAS, IL-6 and TNF-α mRNA expression on postnatal day 28 and day 35, respectively. Results are presented as means ±s.e.m. (n= 9). Arbitrary units represent the relative mRNA expression of the gene of interest to the housekeeping gene. Diet treatments with different letters represent a significant difference (P < 0.05) within an age category.

