FIGURE 3.
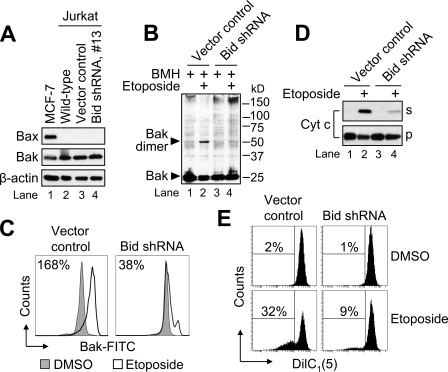
Inhibition of etoposide-induced mitochondrial apoptotic changes in cells lacking Bid. A, whole-cell lysates of Jurkat (E6.1) and MCF-7 (positive control for Bax expression) cells were subjected to SDS-PAGE and Western blotted. B and C, cells (106/ml) were cultured with DMSO or 10 μm etoposide for 6 h and processed for determination of Bak oligomerization by Western blotting (B) or Bak activation by flow cytometric analysis (C). Numbers in C refer to the percentage increase in Bak-associated fluorescence between DMSO- and etoposide-treated samples. D, duplicate aliquots of cells in B and C were harvested and processed for subcellular fractionation. Supernatant (s) and pellet (p) fractions were analyzed by Western blotting. E, duplicate aliquots of cells in B and C were harvested and processed for mitochondrial membrane potential (ΔΨ) determination by flow cytometry. Reduced DiIC1(5) fluorescence is indicative of a loss of ΔΨ, and numbers refer to the percentage of cells that underwent a dissipation of ΔΨ. shRNA, short hairpin RNA; BMH, bismaleimidohexane; Cyt c, cytochrome c.

