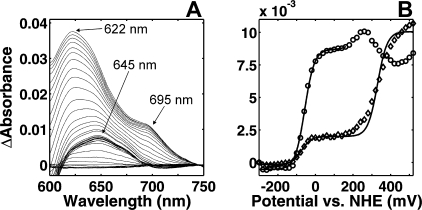
FIGURE 2.
Optical changes in the LMCT band area. A, absorbance changes in the LMCT domain upon a redox titration at pH 7 using the fully reduced spectrum as a reference. B, redox titration profiles at 622 nm minus (610 nm + 660 nm)/2 (224) and at 645 nm minus (610 nm + 700 nm)/2 (○). Theoretical Nernstian n = 1 curves fitted to the experimental data are represented by solid lines below +100 mV and above a theoretical Nernstian curve with an Em,7 value of +330 mV is plotted to the experimental data.

