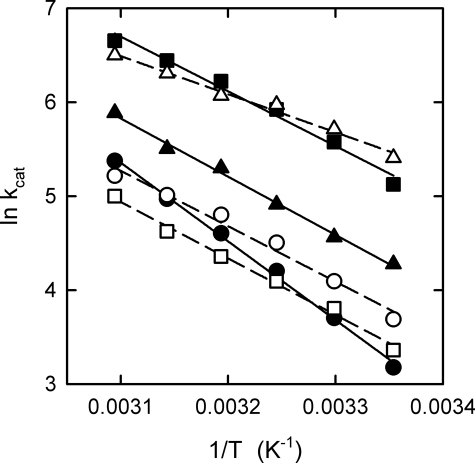
FIGURE 3.
Arrhenius analysis of the ATPase activity of the deletion mutants. ATPase activities were measured at different temperatures (25–50 °C) and were calculated as turnover rates (kcat, in s-1). From the negative slope of the regression lines, the activation energy, Ea, of the rate-limiting step of the overall reaction can be determined (see Table 3). Filled circles, wild-type PS3 ATP synthase; open circles, Δ380LQDI383 deletion mutant; filled squares, Δ384IAIL387; open squares, Δ388GMDE391; filled triangles, Δ392LSD394; open triangles, Δ381QDIIAIL387.

