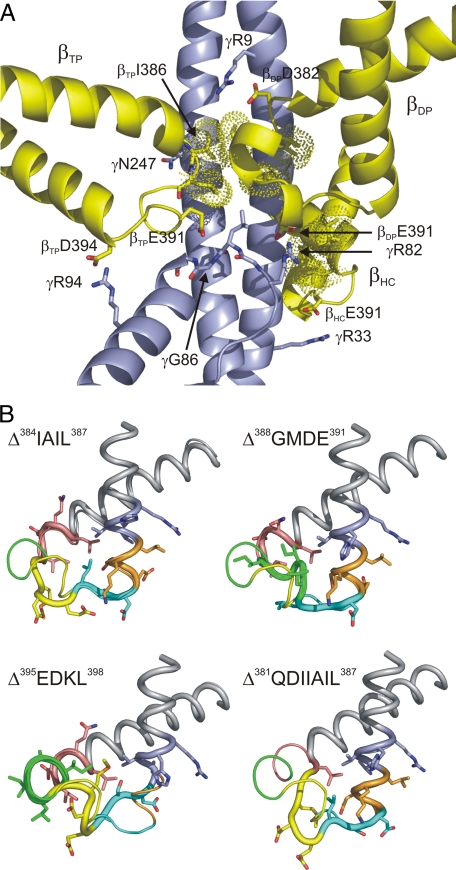
FIGURE 6.
The βDELSEED-loop. A, interactions between the βDELSEED-loop and γ. The DELSEED-loops of the three β subunits are shown in yellow, and γ is shown in blue. Amino acid residues involved in hydrogen bonds/salt bridges are shown in stick representation and labeled using PS3 residue numbers. Dots indicate the van der Waals surface of the side chains of residues βI383, βI386, and βL387 involved in contacts with γ. This figure is based on Protein Data Bank file 1h8e (11), modified to represent the Bacillus PS3 ATP synthase using PRIME. B, models of the βDELSEED-loop of the deletion mutants. The main chain of the respective deletion mutant is shown as the thicker line in cartoon representation and the main chain of the wild-type enzyme as the thinner line. Side chains (in stick representation) are given only for the deletion mutants. Color-coding is as described in the legend for Fig. 1B.

