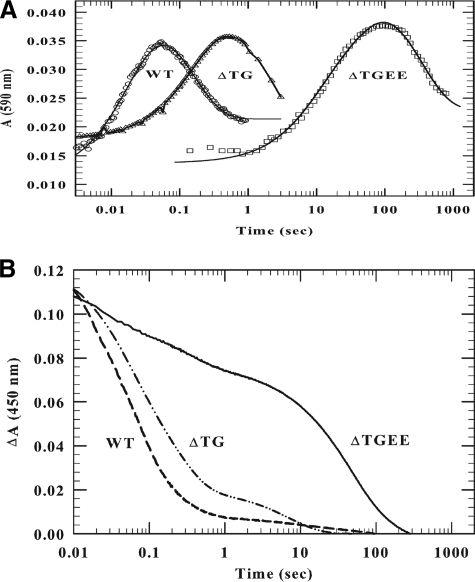
FIGURE 5.
Kinetics of reduction of wild-type, ΔTG, and ΔTGEE CYPOR by 10 molar equivalents of NADPH. The experiment was performed at 25 °C as described in the legend to Fig. 4 and under “Experimental Procedures.” The final reductase concentrations were 15 μm (590 nm) and 10 μm (450 nm). NADPH concentrations were 150 μm and 100 μm to provide a 10-fold molar excess. The absorbance was followed at 590 nm to observe blue semiquinone formation (A) and at 450 nm to estimate flavin reduction (B).

