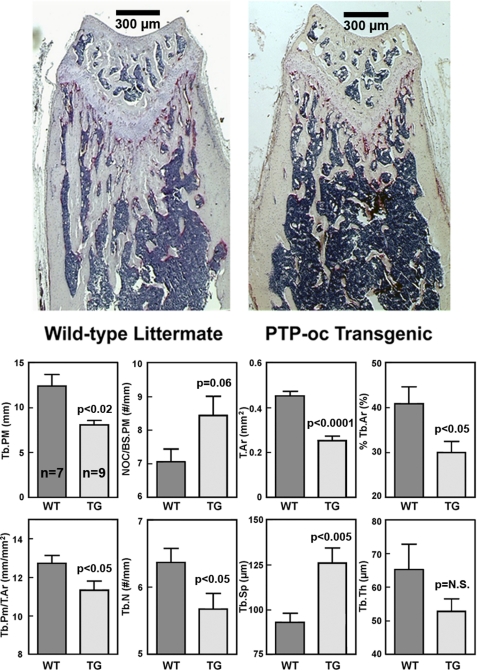
FIGURE 3.
Bone histomorphometric parameters of 10-week-old male F2 transgenic and age-matched male WT littermates at the metaphysis of distal femurs. TRACP+ cells were stained in pink. Bone histomorphometry was performed at the secondary spongiosa (350 μm distal to the growth plate). The top shows a representative longitudinal section of a WT littermate and that of a transgenic mouse. Scale bars, 300 μm. The bottom summarizes the quantitative results (mean ± S.E. of nine transgenic mice and seven WT littermates). Tb.PM, trabecular perimeter; NOC/BS.PM, number of TRACP+ osteoclasts per bone surface length; T.Ar, total tissue area; Tb.Ar, trabecular bone area per total tissue area; Tb.N, trabecular number; Tb.Sp, trabecular separation; Tb.Th, trabecular thickness.

