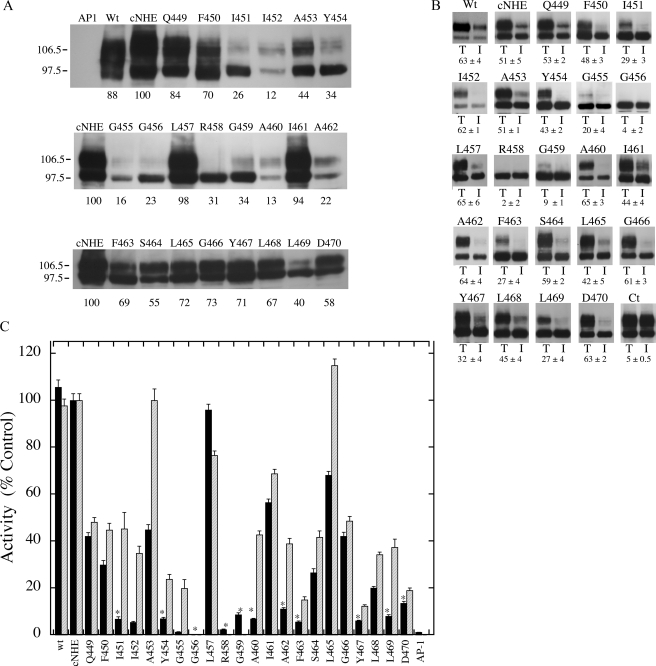
FIGURE 2.
Analysis of wild type and mutant NHE1 proteins. A, Western blot of cell extracts of AP-1 cells containing stably transfected Na+/H+ exchanger mutants or control. In all mutations the amino acid indicated was changed to cysteine. 100 μg of total protein was loaded in each lane. Numbers below the lanes indicate the values obtained from densitometric scans of both the 110- and 95-kDa bands relative to wild type NHE. Results are typical of three to five measurements. AP1 refers to mock transfected AP-1 cells. Wt, refers to cells stably transfected with wild type Na+/H+ exchanger protein. B, subcellular localization of control and TM XI mutants in AP-1 cells. Sulfo-NHS-SS-biotin-treated cells were lysed and streptavidin-agarose beads were used to bind labeled proteins as described under “Experimental Procedures.” Equal amounts of total cell lysate (T) and unbound intracellular lysate (I) were run on SDS-PAGE and Western blotting with anti-HA antibody identified NHE1 protein. Wt, refers to cells stably transfected with wild type Na+/H+ exchanger protein. Ct refers to a control experiment in which nonspecific binding to streptavidin-agarose beads was carried out following the standard procedure but without labeling cells with biotin. The percent of the total NHE1 protein found within the plasma membrane is indicated for each mutant. For Ct the numbers indicate the amount of nonspecific binding to streptavidin-agarose beads. Results are the mean ± S.E. of at least three determinations. C, rate of recovery from an acid load by AP-1 cells stably transfected with cNHE, and TM XI Na+/H+ exchanger mutants. Na+/H+ exchanger activity was measured after transient induction of an acid load as described under “Experimental Procedures.” The activity of cNHE1 stably transfected with NHE1 was 0.036 Δ pH/s, and this value was set to 100%. All mutations to cysteine were done in the background of the cysteine-less NHE1 and activities are percent of those of cNHE. Mutations were in the cNHE1 and results are expressed as mean ± S.E. of 8-16 determinations. Results are shown for mean activity of both uncorrected (black) and normalized for surface processing and expression levels (hatched). * indicates mutants with uncorrected activity that is less than 20% of cNHE1.

