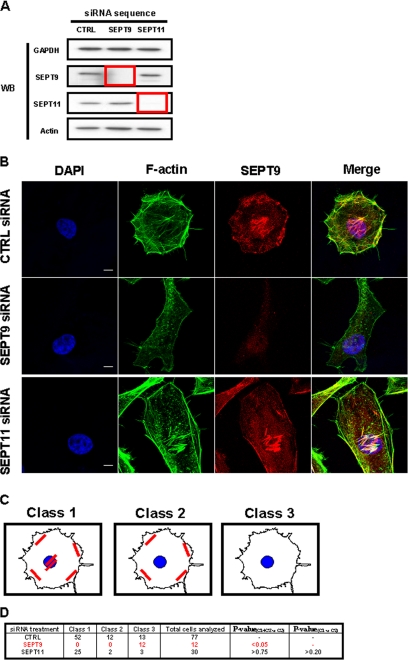
FIGURE 1.
The impact of septin depletion on HeLa cells. A, Western blot (WB) of HeLa cells transfected with siRNA against control (CTRL), SEPT9, or SEPT11. Cell lysates were separated by 10% SDS-PAGE before immunoblotting. The blots were probed with antibodies specific to GAPDH, SEPT9, SEPT11, and actin. GAPDH is shown as a loading control. The red box outlines depleted protein levels for targeted septins. B, septin depletions have different effects on cell shape and actin and septin filament distribution. Endogenous F-actin and SEPT9 were visualized by immunostaining with anti-F-actin (green) and anti-SEPT9 antibodies (red) for control (CTRL)-, SEPT9-, and SEPT11-depleted cells. Nuclei were marked with DAPI (blue). Scale bars indicate 10 μm. C, different classes of SEPT9 filament distribution. In siRNA-treated HeLa cells, septin and actin filaments were distributed into different patterns. Cells presenting filaments around the cell periphery and under the nucleus were designated as Class 1, cells with filaments only around the cell periphery, but not under the nucleus were designated as Class 2, and cells no longer presenting any filaments were designated as Class 3. D, different effects of septin inactivation on the organization of SEPT9 filaments. Confocal Z-stack images of siRNA-treated cells were categorized by a filament tracking algorithm into the three pre-assigned classes of filament distribution (Fig. 1C). The percentage of septin-depleted cells observed to still have filaments, i.e. % of cells in Class 1 and Class 2 versus % of cells in Class 3, was statistically compared with expectations as derived from control cells by chi square test (p value(C1+C2 versus C3)). To assess whether SEPT11-depleted cells retain SEPT9 filaments under the nucleus, the distribution of SEPT9 filaments in SEPT11-depleted cells, i.e. % of cells in Class 1 versus % of cells in Class 2, was statistically compared with expectations as derived from control cells by chi square test (p value(C1 versus C2)).

