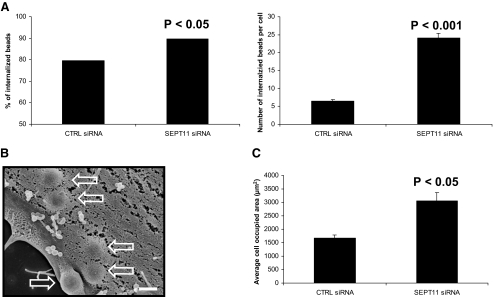
FIGURE 3.
SEPT11 inactivation increases the entry of InlB-coated beads. A, quantification of InlB-induced phagocytosis for control (CTRL) and SEPT11-depleted HeLa cells. For internalization assays, beads were analyzed by immunofluorescence (see “Experimental Procedures”) for being extracellular or intracellular in at least 50 host cells counted for each of n ≥ 2 separate experiments per siRNA treatment. The left graph depicts the total % of internalized 1-μm InlB-coated beads at 5-min postincubation of siRNA-treated cells, calculated from the (total number of internalized beads)/(total number of cell-associated beads) × 100. Results were analyzed for statistical significance using the z-test for percentages. The right graph depicts the average number of internalized 1-μm InlB-coated beads per cell at 5-min postincubation of siRNA-treated cells. Graphed data represent this average value ± S.E., where results were analyzed for statistical significance using the two sample z-test. B, uptake of InlB beads by siRNA-treated cells. Control (CTRL) and SEPT11-depleted HeLa cells were incubated with 1-μm InlB beads for 5 min, and cells were processed for scanning electron microscopy. Depicted here is a representative images of InlB beads internalized for SEPT11-depleted cells. Hollow arrows indicate internalized beads. Magnification = 15,000 ×, where the scale bar indicates 1 μm. C, comparing the average surface areas of siRNA-treated cells. To quantify the surface area of siRNA-treated HeLa cells, confocal Z-stack images of cells were segmented using MetaMorph. Bar graphs depict the average cell occupied area (μm2) ± S.E. for control (CTRL)(n = 77)- and SEPT11 (n = 30)-depleted cells. The cell-occupied area for each septin-depleted cell type was then statistically compared with control cells by Student's t test.

