FIGURE 4.
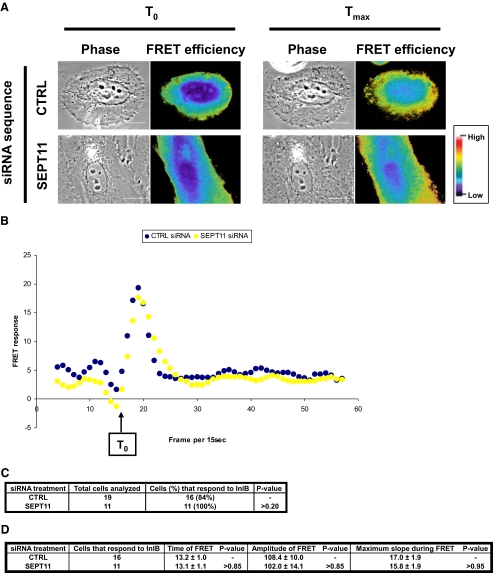
SEPT11-depleted cells respond to InlB stimulation. A, representative FRET efficiency images for control (CTRL) and SEPT11-depleted HeLa cells expressing YFP-AktPH and CFP-AktPH stimulated with InlB. FRET efficiency at two time points are presented for each cell type: T0 (frame 16) and Tmax (frame corresponding to the maximum induction of FRET efficiency) after stimulation. Pseudocolor scale represents the range of FRET efficiency values from original signal ranging from blue (low) to red (high). Scale bars indicate 10 μm. Movies for the entire time course of InlB stimulation for these cells can be observed in the supplemental movies S1A and S1B. B, quantification of FRET response for septin-depleted cells. Processed FRET response was plotted against time (i.e. frame per 15 s), for the representative siRNA-treated cells depicted in Fig. 4A. Values from the control (CTRL) cell are plotted in black, and the SEPT11-depleted cell is in yellow. C, percentage of cells that respond to InlB treatment. Processed FRET response was determined for 11 or more experiments for each siRNA treatment. Cells were classified as not responding to InlB stimulation if the slope of processed FRET response could not be distinguished above baseline values. The percentage of SEPT11-depleted cells classified as not responding to InlB stimulation was statistically compared with expectations as derived from control cells by chi square test. D, summary of FRET characteristics for cells that respond to InlB treatment. Characteristics of the FRET response (time, amplitude, and maximum slope) were evaluated for control (CTRL)- and SEPT11-depleted cells that respond to InlB treatment, and p values were determined by Student's t test.

