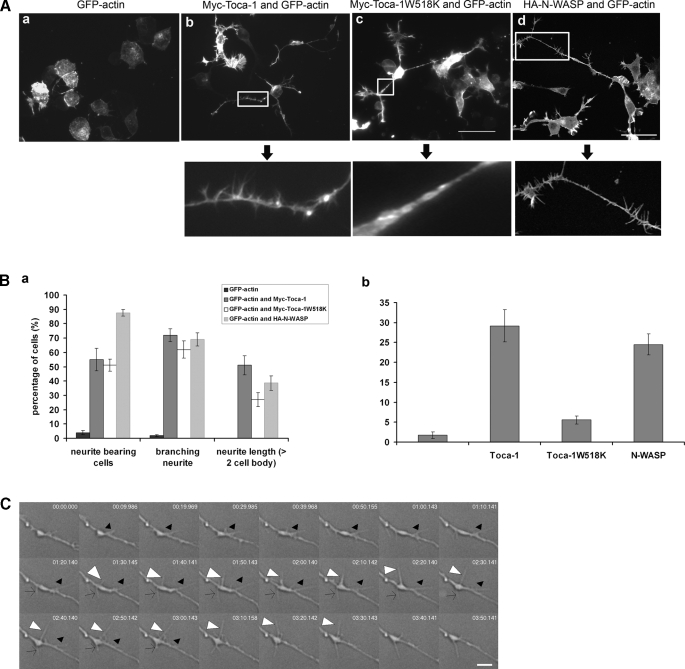
FIGURE 1.
Toca-1 and N-WASP induce filopodia and neurites in N1E115 cells. A, N1E115 cells were transfected with GFP-actin, GFP-actin/Myc-Toca-1, or GFP-actin/Myc-Toca-1W518K and GFP-actin/HA-N-WASP. GFP fluorescence was monitored by confocal microscopy. The panels below the arrows show enlarged neurites to allow monitoring of complexity and filopodial formation. Bar = 50 μm. B, bar charts show statistical analysis (for at least three independent experiments, n = 15 cells). Cells were scored for neurites and filopodia as described under “Materials and Methods.” Data are presented as mean ± S.D. C, to measure filopodial characteristics we used DIC time-lapse microscopy. Individual filopodia were followed from appearance to disappearance and the time required defined as the lifetime. Length of filopodia is the maximum length as measured from the base to the tip under DIC. All these experiments include sequential GFP-actin imaging to ensure that the structures contain actin. To assess the characteristics of the Toca-1-induced filopodia we carried out DIC time-lapse experiments of transfected cells. The DIC image shows a typical neurite with associated Toca-1-induced filopodia over a time course as indicated in individual frames. Arrowheads (empty, white, and black) follow three independent filopodia over the time course. Bar = 4 μm.

