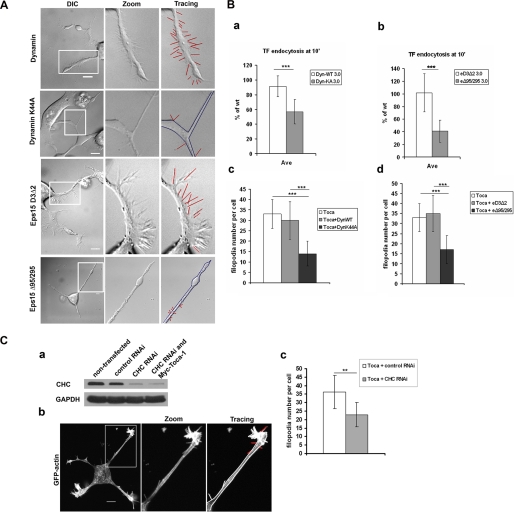
FIGURE 9.
Effect of inhibitors of endocytosis on filopodial formation. A, N1E115 cells were transfected with Toca-1, GFP, or mRFP-actin, and either Eps15 (inactive variant or dominant negative) or Dynamin (wild-type or dominant negative). Cells were then imaged in the GFP and DIC channels. Imaging was carried out using Olympus FV1000 confocal microscope. B, endocytosis and filopodial formation were measured as described under “Materials and Methods.” Bar charts (a and b) show transferrin (TF) uptake. Bar charts (c and d) show filopodial number per cell. Three independent experiments were carried out (with n = 10-15) and one representative example is presented. C, protein expression of CHC was analyzed by Western blotting of cell extracts obtained with or without RNAi (a) as described under “Materials and Methods.” b, Toca-1-mediated filopodial formation was measured in cells transfected with Toca-1, GFP-actin, and +/- RNAi (first panel). Second panel shows an enlargement of the neurite of the cell. Third panel shows a tracing with filopodia indicated in red. Statistical analysis of the experiment is presented as a bar chart in c. Three independent experiments were carried out (with n = 10-15) and one representative example is presented. Data are presented as mean ± S.D. Experimental data were analyzed by Student's t test. Difference was significant when p < 0.05 (* stands for p < 0.05; ** for p < 0.01; *** for p < 0.001). Bar = 10 μm.

