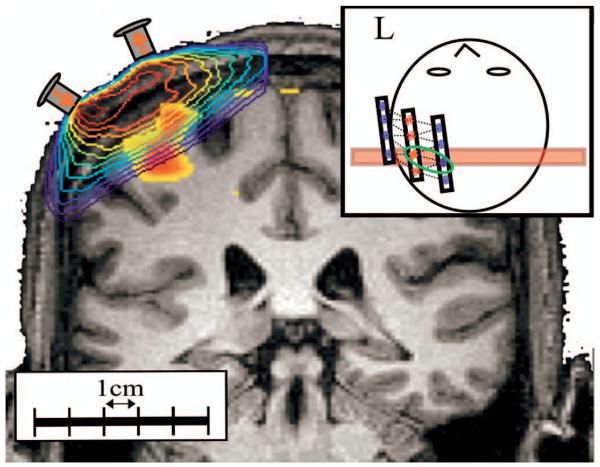
Fig. 3.
Monte Carlo simulations were used to generate the optical sensitivity profiles for each source and detector pair. A representative profile is shown here overlaying the anatomical volume (subject B). This image is shown in logarithmic scale and contours are presented for each order of magnitude. The inset at the top right shows the location of this coronal slice relative to the optical probe. To show the location of the activation, the t map for the BOLD signal (masked at half maximum) is shown overlaying the anatomical volume. The forward modeling of the BOLD signal involves the multiplication of the BOLD activation and the sensitivity matrix (A). This is equivalent to the sensitivity-weighted sum over the volume of the BOLD contrast changes.

