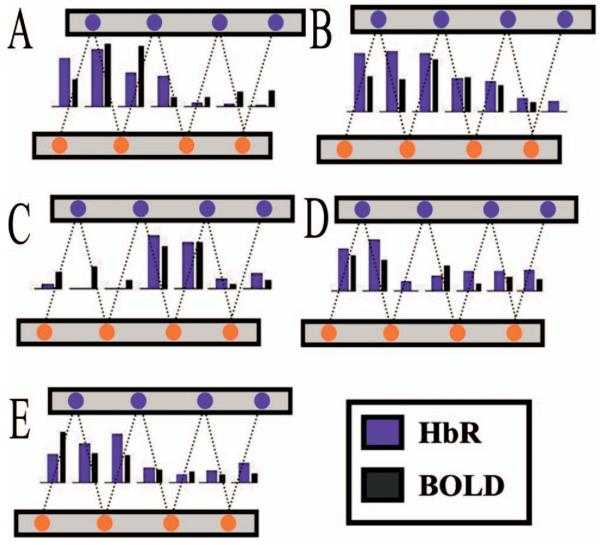
Fig. 5.
In order to better investigate the spatial correlation between the time course shown in Fig. 4, the mean response amplitude of the period of 3 to 9 seconds was calculated for each source-detector pair. Shown as bar graphs above, the amplitude variation across the probe was coincident between the two modalities.

