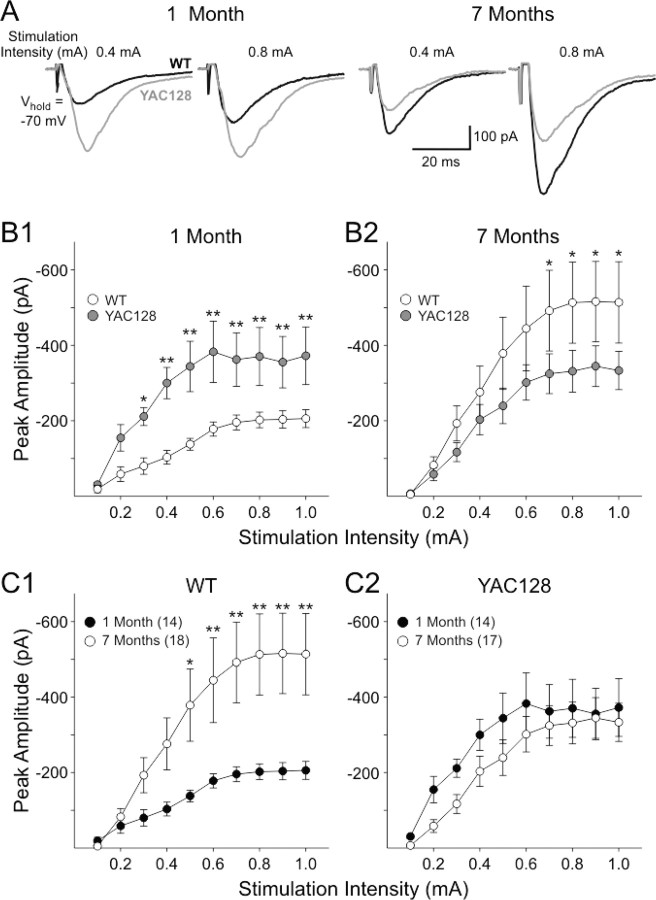
Figure 1.
AMPA receptor-mediated synaptic responses in YAC128 mice. A, Representative traces showing inward currents evoked by the same two intensities of stimulation in cells from YAC128 and WT mice at each age. B, Graphs showing mean ± SE peak current evoked by the series of increasing intensities of stimulation at 1 month (B1) and 7 months (B2). C, Graphs showing comparisons of mean ± SE peak current responses for cells from WT (C1) and YAC128 (C2) mice at each age. Numbers of cells for each age group for all graphs are shown in C1 and C2.

