
Figure 3.
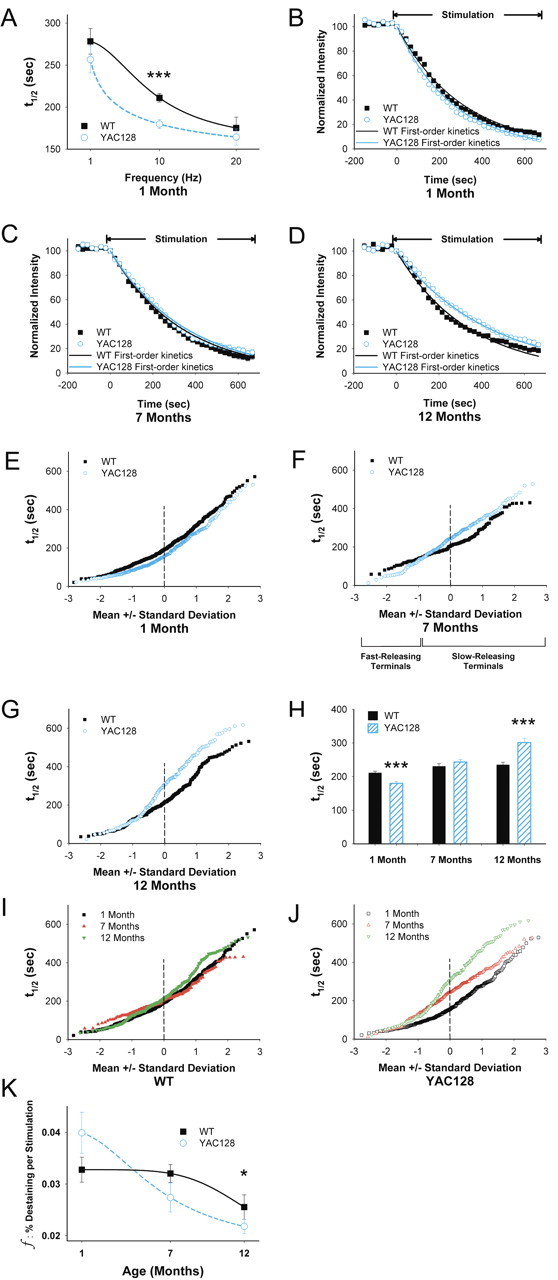
Age-dependent changes in corticostriatal release. A, FM1-43 destaining is dependent on the frequency of cortical stimulation. n = 89–425 puncta for each condition; ***p < 0.001, Mann–Whitney test. B, Time–intensity analysis of FM1-43 destaining in slices from YAC128 mice at 1 month demonstrates an increase in release compared with same-aged WTs. Release from both WT and YAC128 mice approximate first-order kinetics. C, Time–intensity analysis of FM1-43 release in slices from YAC128 mice at 7 months demonstrates a similar rate of destaining compared with WTs. Release from both WT and YAC128 mice approximated first-order kinetics. D, At 12 months, FM1-43 release in slices from YAC128 mice showed a slower rate of destaining compared with WTs, with release approximating single-exponent kinetics. E, Normal probability plot of individual terminal halftimes of release from averaged puncta shown in B. F, Individual terminal halftimes of release from averaged puncta shown in C. G, Individual terminal halftimes of release from averaged puncta shown in D. H, Distribution of mean t1/2 of release for destaining curves shown in B–D. For WTs, n = 425, 160, and 258 puncta at 1, 7,and 12 months, respectively. For YAC128 mice, n = 353, 196, and 139 puncta at 1, 7, and 12 months, respectively. ***p < 0.001 compared with WT littermates, Mann–Whitney test. I, Individual terminal halftimes of release in WTs at 1, 7, and 12 months. J, Individual terminal halftimes of release in YAC128 mice at 1, 7, and 12 months. K, The fractional release of FM1-43 declined with age. n = 31 for each condition, *p < 0.05, ANOVA. Curves for A and K were fit with a Hill equation.