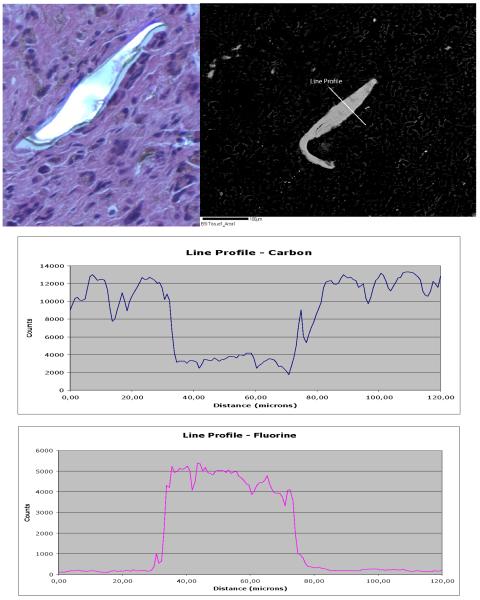
Figure 6.
Upper left corner: Selected H&% histological section for EMA showing a multinucleated giant cell reaction to PTE implant fragment. (H & E. Magnification: 200X). Upper right corner: BSI with a labeled Line profile. Bottom: Line profile graphs with Carbon (upper) and Fluorine (bottom) x-ray counts.

