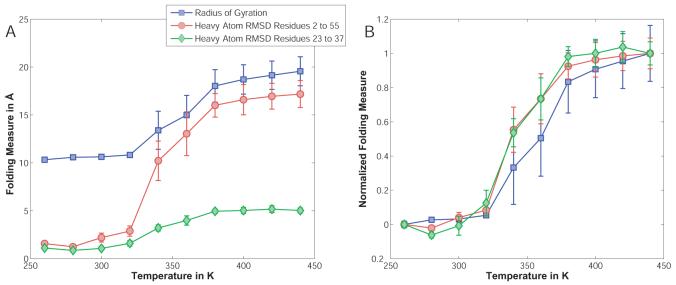
Figure 6.
Unfolding measures for the B1 domain of protein G as a function of simulation temperature. Panel A shows two raw values for the RMSD to the PDB structure, i) for all heavy backbone atoms excluding the terminal residues; and ii) for just the heavy backbone atoms in the helical portion of the protein, along with the radius of gyration. The RMSD is based on structural alignments using only the corresponding residues as alignment criteria. Panel B shows values for all three measures normalized to their end points at 260K (0.0, fully folded) as well as 440K (1.0, fully unfolded). Error bars are obtained through block averaging, using a block size of 5×10⁵ MC steps.

