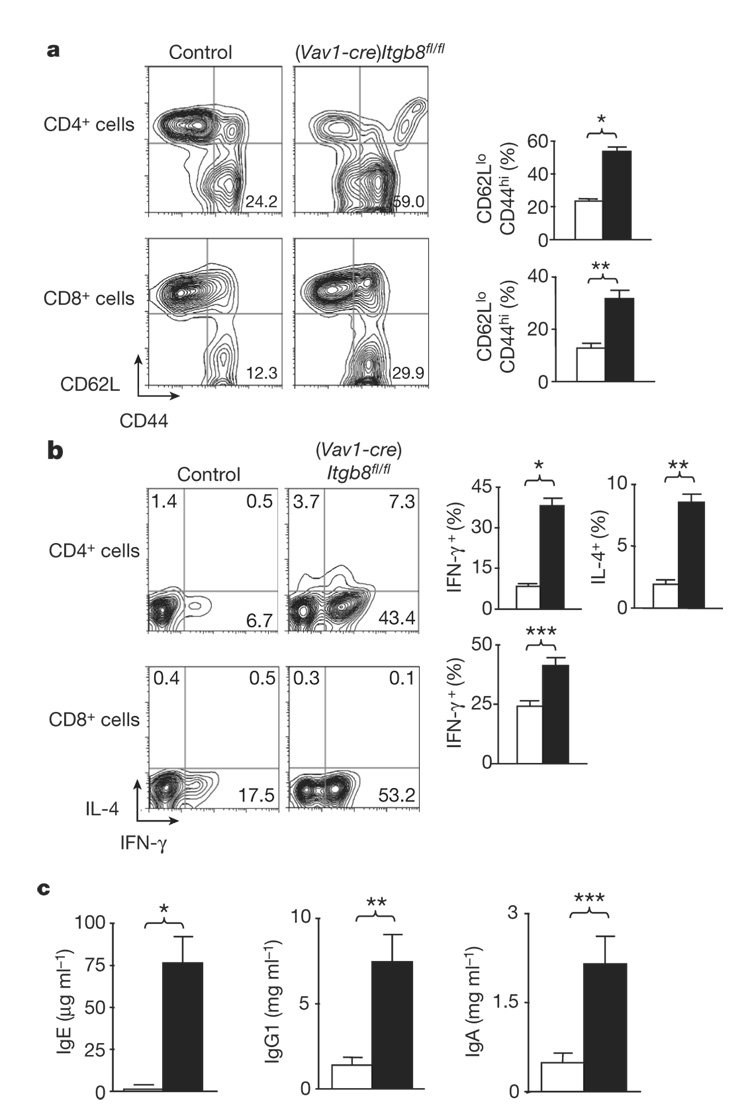
Figure 2. (Vav1-cre)Itgb8fl/fl mice develop enhanced numbers of activated/memory T cells expressing IL-4 and IFN-γ, and increased serum IgE, IgG1 and IgA levels.
a, Activated/memory T cells from spleen (CD62LlowCD44high, 4–6-month-old mice) were analysed by flow cytometry. Representative flow cytometry plots and plotted mean values are shown (white, control; black, (Vav1-cre)Itgb8fl/fl; n=14; asterisk, P=2.7×10⁻¹¹; double asterisk, P=4.9×10⁻⁵). b, IL-4 and IFN-γ levels in T cells from spleen were analysed by intracellular flow cytometry. Representative flow cytometry plots and plotted mean values are shown (white, control; black, (Vav1-cre)Itgb8fl/fl; n=9; asterisk, P=1.8×10⁻⁸; double asterisk, P=1.8×10⁻⁷; triple asterisk, P=0.00048). c, ELISA for IgE, IgG1 and IgA levels in sera (4–6-month-old mice; white, control; black, (Vav1-cre)Itgb8fl/fl; n=4; asterisk, P=0.0028; double asterisk, P=0.011; triple asterisk, P=0.016). All error bars represent s.e.m.

