Figure 1.
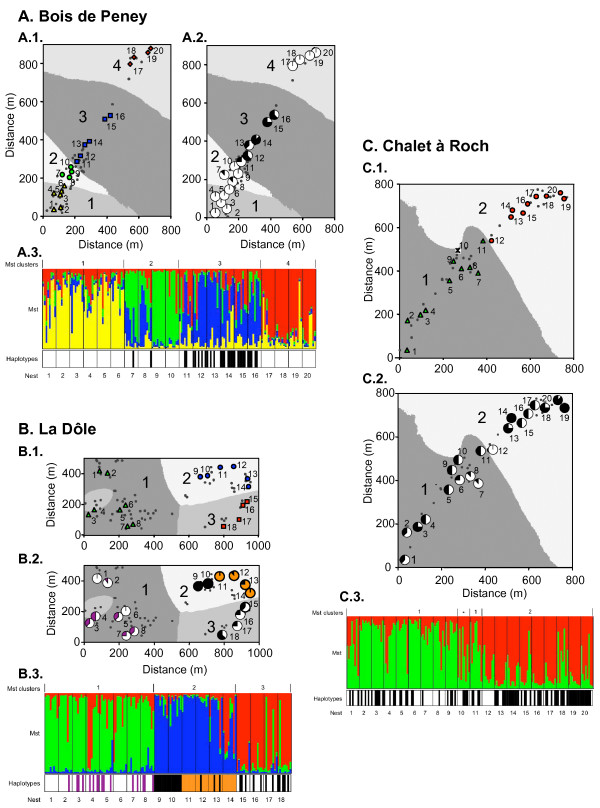
Genetic clustering of nests. The cryptic genetic structure of three populations of F. paralugubris at Bois de Peney (A), La Dôle (B) and Chalet à Roch (C). Panels 1 (A.1, B.1 and C.1) show synthetic maps of the clusters detected when analysing the microsatellite genotypes with the program Geneland. Large numbers indicate the cluster, grey tones the cluster area, and small numbers the sampled nests. Symbols in color represent sampled nests belonging to the same cluster, and small black dots indicate nests in the vicinity of sampled nests. The asterisk in the population Chalet à Roch (C.1) indicates a nest with a posterior probability close to 0.5 to belong to one or the other cluster. Panels 2 show the distribution and frequency per nest of the mitochondrial haplotypes (violet: H1; orange: H2; white: H3; black: H4). The upper parts of panels 3 (Mst) show the population structure detected when analysing the microsatellite genotypes with the program Structure. Each individual is represented by a vertical line, which is partitioned into k coloured segments that represent the individuals's estimated membership fractions in k clusters. The bottom parts of panels 3 (Haplotypes) show the haplotype for each individual, given as a violet (H1), orange (H2), white (H3) or black (H4) bar. Thin lines in panels 3 separate individuals from different nests. Microsatellite clusters in panels 2 and 3 correspond to the ones detected with Geneland in panels 1.

