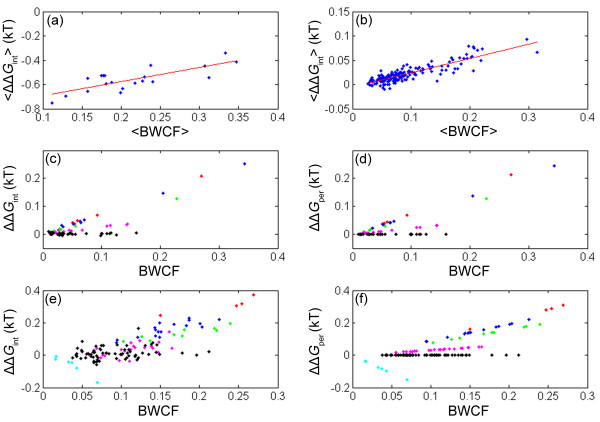
Figure 3.
Plots of different measures of the strength of pairwise interactions as a function of measures of contact frequency for several representative examples of lattice models. In panels a and b, the average coupling energies, <ΔΔGint>, of all the pairs in contact (a) and not in contact (b) are plotted against their respective average BWCF in the case of a set of sequences with 30 residues that have the same native conformation on a lattice of 5 × 6. In panels c and d, the coupling (c) and perturbation (d) energies, ΔΔGint and ΔΔGper, are plotted against the BWCF for all the pairs of positions not in contact in the case of a sequence with L = 20 on a 2D lattice with full enumeration. In panels e and f, the coupling (e) and perturbation (f) energies are plotted against the BWCF for all the pairs of positions not in contact in the case of a sequence with L = 27 on a 3 × 3 × 3 cubic lattice. The data in panels c-f corresponding to different values of λ are color coded, as follows: λ = -1.25, red; λ = -1, blue; λ = -0.75, green; λ = -0.25, magenta; λ = 0, black; λ = 1, cyan.

