
Figure 2. ICl,swell is inhibited by CBX.
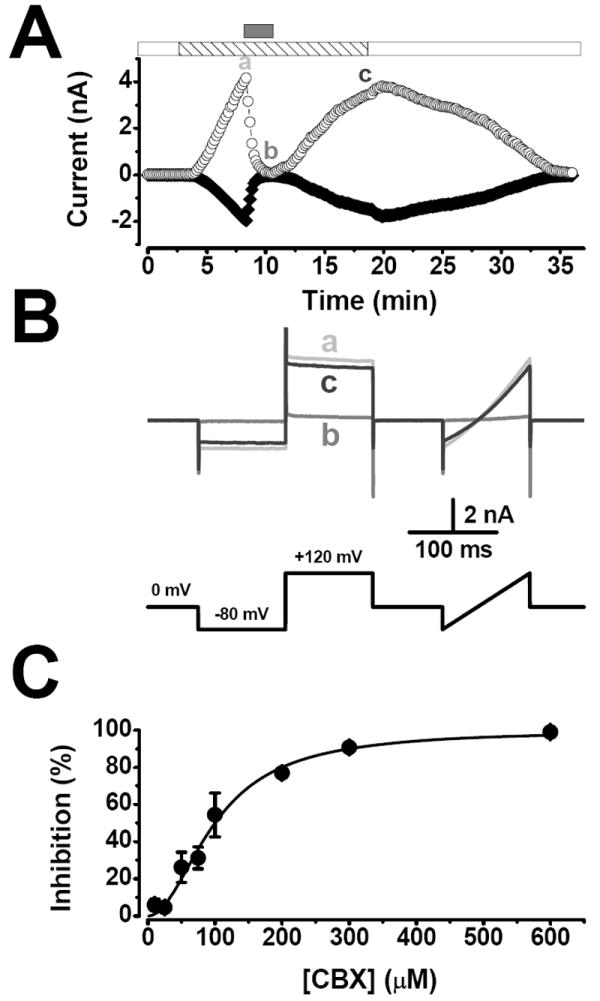
A.- Time course of ICl,swell activation at +120 (○) and −80 mV (◆) by exposure to hypotonic TEACl solution (striped bar). CBX (600 μM; gray bar) reversibly inhibited ICl,swell. After washing CBX with a hypotonic solution IClswell was turned off by a hypertonic TEACl solution (white bar). B.- Representative current traces at the time indicated: a (hypotonic solution alone), b (CBX in a hypotonic solution) and c (hypotonic solution alone). The voltage protocol used is shown below the traces. C.- Dose-response curve for inhibition of ICl,swell by CBX. Percentage of inhibition at +120 mV was calculated relative to inhibition observed with 600 μM CBX. Continuous line is the fit of equation 1 with IC50 of 98 μM. n=3-8.